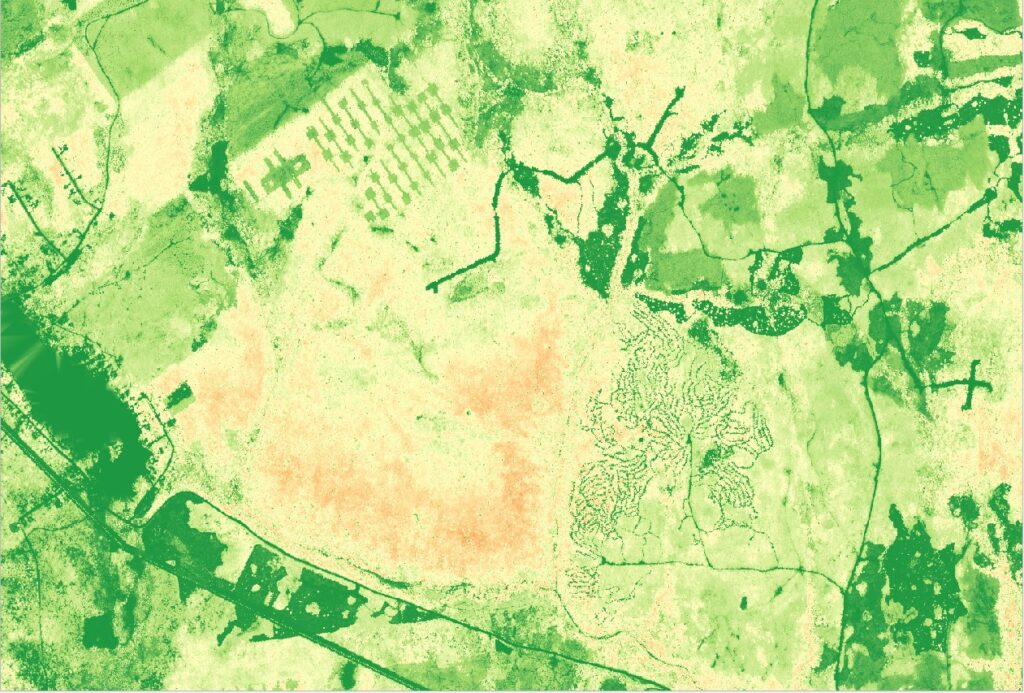
In part 2 of our tech deep dive we are continuing on talking about Lidar. In part 1 we covered some of the basics about Lidar platforms. In part 2 we’re delving deeper into how Lidar can be used in forest management.
By far the greatest challenge of forest management is the sheer scale of the lands managed. Understanding the complexity of forest structure and variation is difficult in even a small area, let alone across thousands of square kilometers.
To do their work effectively, foresters need accurate information for many complex metrics across the entire landbase that they manage. Lidar provides one of the richest possible datasets allowing for unparalleled insights.

Here are three applications of lidar in forestry
Crown Closure
Measuring crown closure has a variety of uses in forest management. It is an easy to calculate proxy for stocking and stand density. Areas of little to no crown closure can indicate recent disturbances such as windthrow, harvesting or wildfire.
Lidar can be used to accurately measure crown closure over a large area and there are several methods to accomplish this. Most divide the area of interest into a raster grid, with each cell representing one measurement.
You could simply use a presence/absence measure of above ground returns vs ground returns. With this method any areas with only ground returns would have no crown closure, and any areas with at least one above ground return has at least some canopy closure.
Read more and see an example of how to calculate crown closure here:
Terrain Mapping
Terrain has a major effect on forest management. The topography of an area determines the moisture characteristics of a site which in turn will drive species composition and ecological considerations. Slope affects where harvesting can occur and the equipment needed. Optimal road locations depend heavily on knowing features of terrain.
There is no other technology that offers the same level of detailed terrain mapping as Lidar. With airborne lidar, highly accurate terrain models, with sub 1 meter resolutions, can be created over vast areas. With its ability to see through obstacles like vegetation, Lidar is able to accurately map the shape of terrain even where there is dense vegetation cover.
Elevation data from Lidar is typically rendered as a digital elevation model or DEM. This is a raster image where the value of each pixel represents the height of the terrain. A DEM can be applied to further algorithms to calculate values like slope and aspect. This information can be used to create a predictive water flow map allowing for the location of wetlands and watercourses to be determined.
This high resolution terrain data is useful for locating new logging roads, or harvest landings and makes working in areas of steep terrain much easier.
Forest Inventory
Forest management needs to have an accurate characterization of the forest. In the past this was mostly done through ground plots and manual cruising. While photo interpretation can provide certain information, any detail about stand composition, diameter, basal area and volume generally could only be achieved with manual sampling.
Enter Lidar data. With its ability to get multiple returns from different locations within the canopy, Lidar data can be combined with ground plots to create accurate, landscape level forest inventory.
The process itself can become quite complex, but consists of a few main steps.
First Lidar data is acquired over the area of interest. From these data, different metrics about point density, the height distribution of points, the ratio of ground vs tree points and other statistics can be calculated. Usually this is done by overlaying a grid on the area of interest. Metrics are then calculated for each cell within this grid.
Next, a series of sample plots are conducted across the landbase. Generally these plots consist of fixed radius plots where every tree within the plot is measured. Attributes like height, basal area, diameter, stocking and live crown percentage are generally collected.
These plots must both be accurately geographically located, and be representative of all forest conditions within the area of interest. Generally, survey grade GPS is used to measure the center point of each plot.
With the plot data and Lidar metrics, the inventory model can be created. Here a statistical model, generally either a linear regression or a random forest simulation is used to predict the measured inventory parameters based on the Lidar metrics.
These types of models are often written in a programming language like Python, just one of the many tasks that can be accomplished. One of the best ways to learn Python is Sawfly’s Python Foundations Course
Different metrics, or combinations of metrics may predict certain inventory attributes better than others. This will vary depending on conditions and the way the data was collected.
Once a suitably precise model has been created it can be applied to all cells laid over the area of interest to predict forest metrics across the entire landbase.
One limitation of Lidar based forest inventory is the ability to predict species with any sort of accuracy. In this instance the species can be determined either through manual photo interpretation or by using imagery data to build a predictive model for tree species.
We’ve Covered a lot of ground so far, but we’re going even deeper. In part 3 we’re going to talk about how to get started working with Lidar data, including some free software applications. Make sure you’re subscribed to our email list so you don’t miss that post!